Tutorial 1. Simple REPLACE
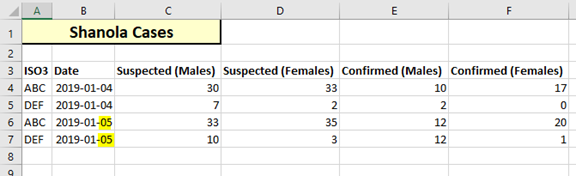
In this example, there is an outbreak of an imaginary new disease called “Shanola”. A simple spreadsheet has been created to track daily case counts for the affected countries.
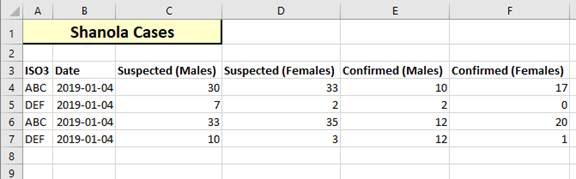
A simple approach to loading the data will be followed. At upload time, all data previously uploaded will be completely replaced by the new data in the spreadsheet, and no lookups will occur.
Did you notice the error in the data? The date is always the same ….
Create the data model
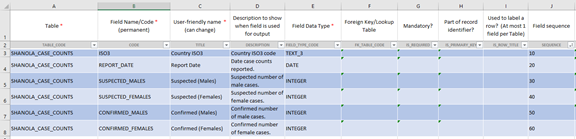
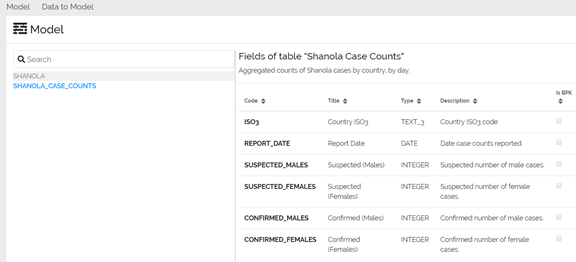
We first define the structure of the table that will be created in the data mart to store this data.
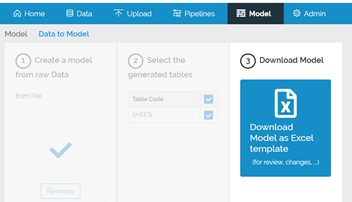
Data to Model is used to suggest a model:
The model suggested by the system is not perfect, so it is manually adjusted until acceptable.
This is a very simple example (so there are no required fields, unique identifiers or any foreign keys).
The data model Excel file is uploaded on the Data Upload using the “Update Model” origin and the model is created
Pipeline
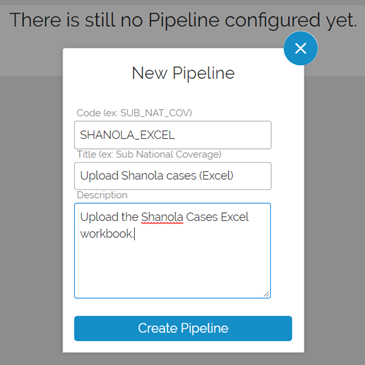
A new pipeline is created by going to Pipelines and clicking “New”. This will create the pipeline plus one default origin of the same name.
To configure the pipeline, click “configure”. The pipeline can be edited directly in the window that opens, or you can use your favorite xml editor and paste the result into the window.
The Save button allows you to save your work even if there are errors with the file. Saving the pipeline does not affect the currently active pipeline. To replace the currently active pipeline, press the Publish button. Only valid pipelines can be published. To test if a pipeline is valid, press the Validate button.
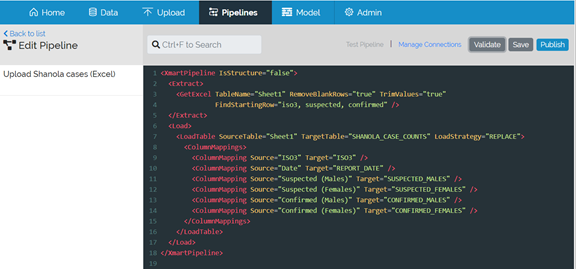
Here is the Xml for our simple pipeline.
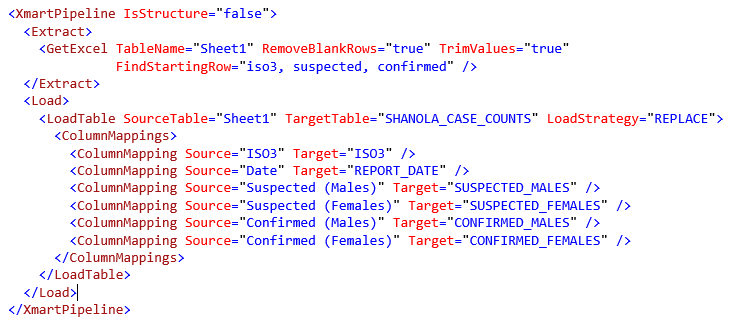
Let’s breakdown the pipeline one piece at a time.
<XmartPipeline IsStructure="false">
XmartPipeline is the root element of the pipeline.
IsStructure=”false” indicates that this is a normal data pipeline, as opposed to a pipeline that is updating the data model (a special pipeline. Basically just leave this as it is.
<GetExcel TableName=”Sheet1” RemoveBlankRows=”true” TrimValues=”true”
FindStartingRow=”iso3, suspected, confirmed” />
The GetExcel command defines how the data is to be read from the Excel workbook provided at upload time.
TableName refers to the name of the worksheet.
RemoveBlankRows will result in the removal of all completely blank rows. This should almost always be set to true.
TrimValues causes all values to have leading- and trailing whitespace (spaces and tabs) removed. This almost always a good idea for surveillance data (but may not be desireable for paragraph type content in some cases).
FindStartingRow is one of the most useful attributes of the GetExcel command. This should be populated by a comma-separated list of fragments of text found in the row that is the column header. The column header must contain all of the fragments, but the fragments can be located anywhere in any of the column names.
<LoadTable SourceTable="Sheet1" TargetTable="SHANOLA_CASE_COUNTS" LoadStrategy="REPLACE">
The LoadTable command instructs the system that “Sheet1” (the SourceTable) is being loaded into “SHANOLA_CASE_COUNTS” (the TargetTable).
The LoadStrategy value can be either REPLACE or MERGE. For our simple example, the load strategy is REPLACE; existing data is dropped and replaced by the new data. No history is maintained when doing REPLACE, though dropped data is temporarily stored in backup tables for a limited period of time (several weeks). It is possible to specify a range of data to drop with REPLACE rather than dropping the entire table, but that is another lesson.
<ColumnMapping Source="Suspected (Males)" Target="SUSPECTED_MALES" />
ColumnMapping defines which source columns should be loaded into which column as defined in our data model.
Make sure the pipeline is published (press the Publish button), so we can now upload data ….
Uploading Data
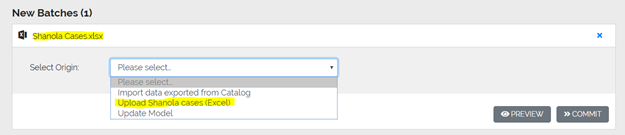
To use the pipeline, drag the “Shanola Cases.xlsx” file on to the drop zone of the Upload page. The file appears at the bottom of the screen under “New Batches (1)”.
In the dropdown, choose “Upload Shanola cases (Excel)”, which is the friendly Title of the default origin just created when we created the pipeline. Then click Preview.
The 4 rows are visible and there are no rows in error.
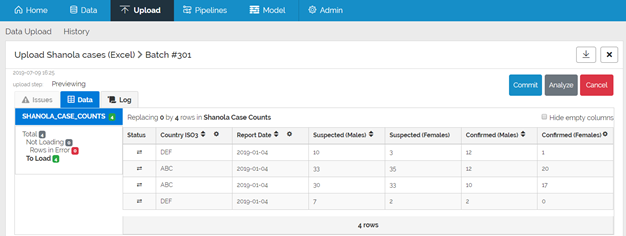
Press the Commit button to commit the data to the data mart.
Viewing Data
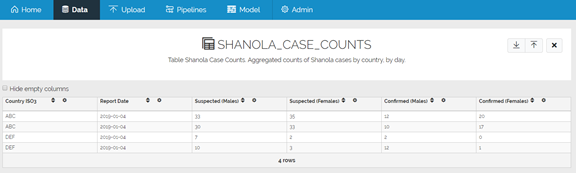
To view the uploaded data, go to the Data page and find the SHANOLA_CASE_COUNTS data view
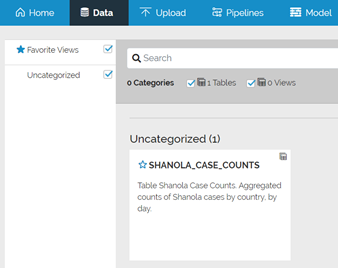
Click on the SHANOLA_CASE_COUNTS card to view the data.
Fixing the error
Lucky for us, we happen to notice that the date is repeated for all 4 rows. Let’s fix that:
And reload:
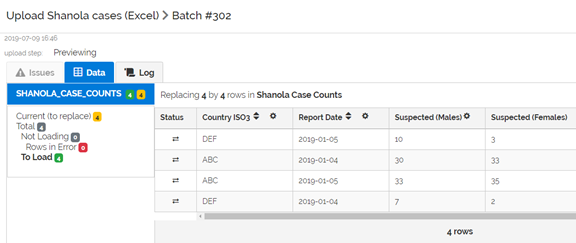
Even though we’ve only edited 2 rows, the system will load all 4 rows again. It also indicates that there are 4 rows “to replace”.
Why is this?
It’s because we are using the REPLACE strategy. We are replacing the existing 4 rows by the new 4 rows. The system does not know which rows have changed ….
If you want the system to identify which rows have changed vs which rows are unchanged vs which rows are new, we need to use the MERGE strategy.
And to use the MERGE strategy, we must define the primary keys of our data.