Navigate to the Mart.
Select Data to see a list of tables and select one to view the data.
!
Select a table to see the data.
Filtering and Statistics
In order to filter and view the statistics on a column, click on the heading. In this case, we are going to look at the region codes in REF_COUNTRY.
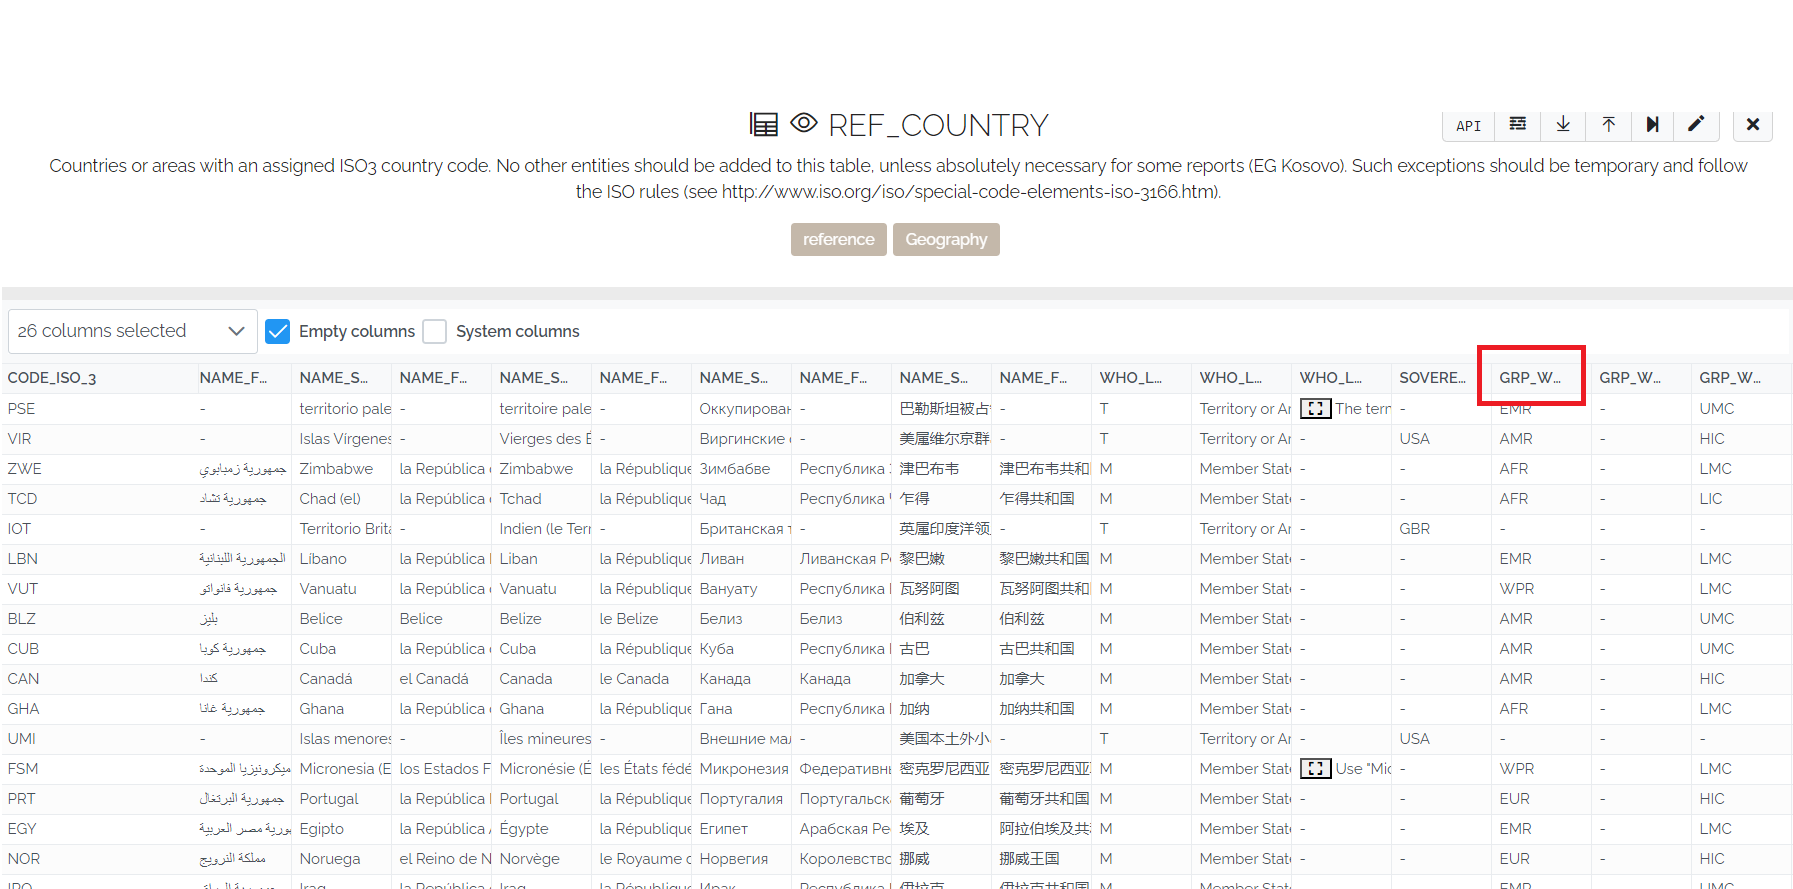
This will bring up the Column Pop-up
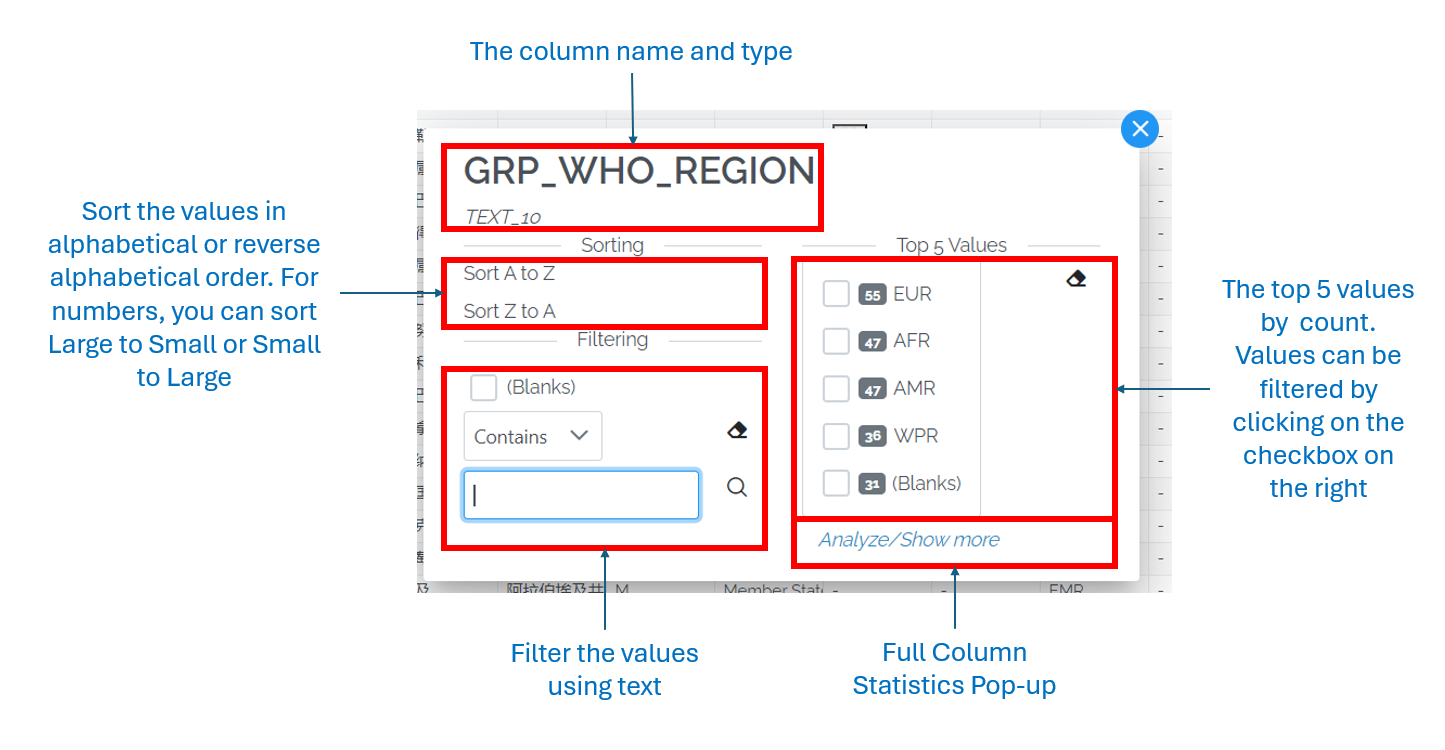
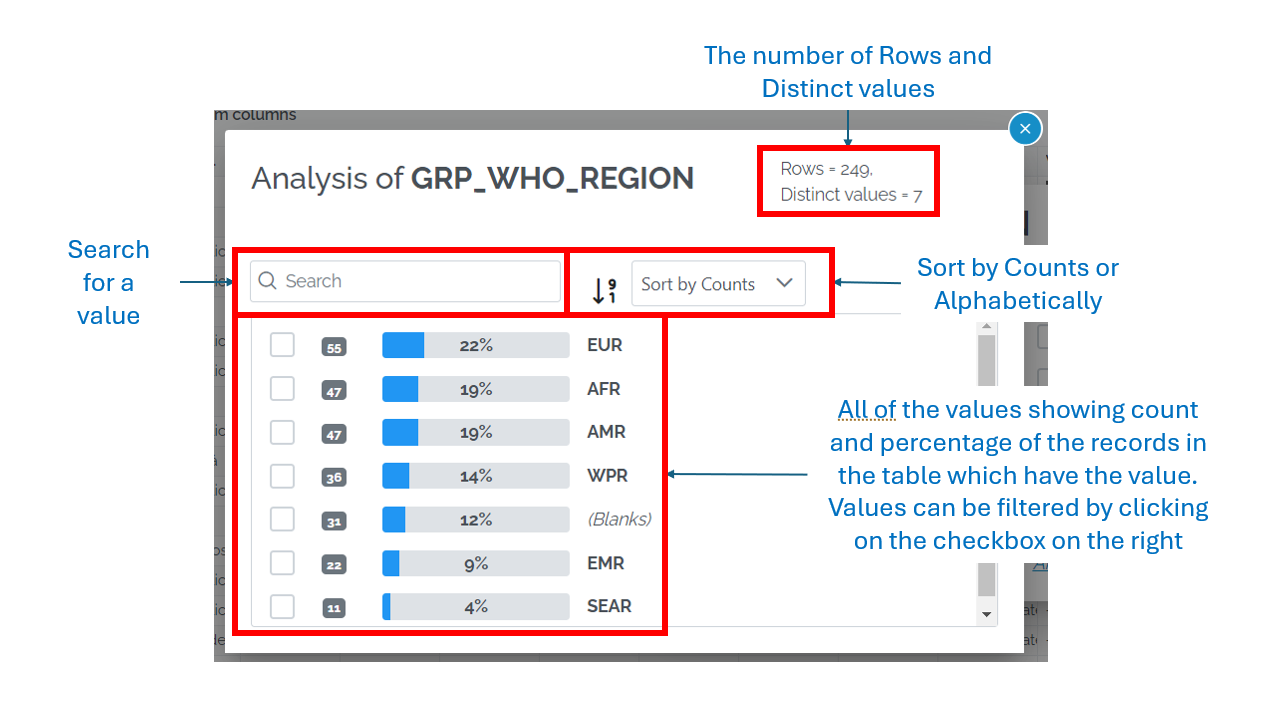
On the left is a box showing the top 5 values with the count of the records for each value. At the bottom is an Analyze/Show more button which brings up an Analysis for all of the records.
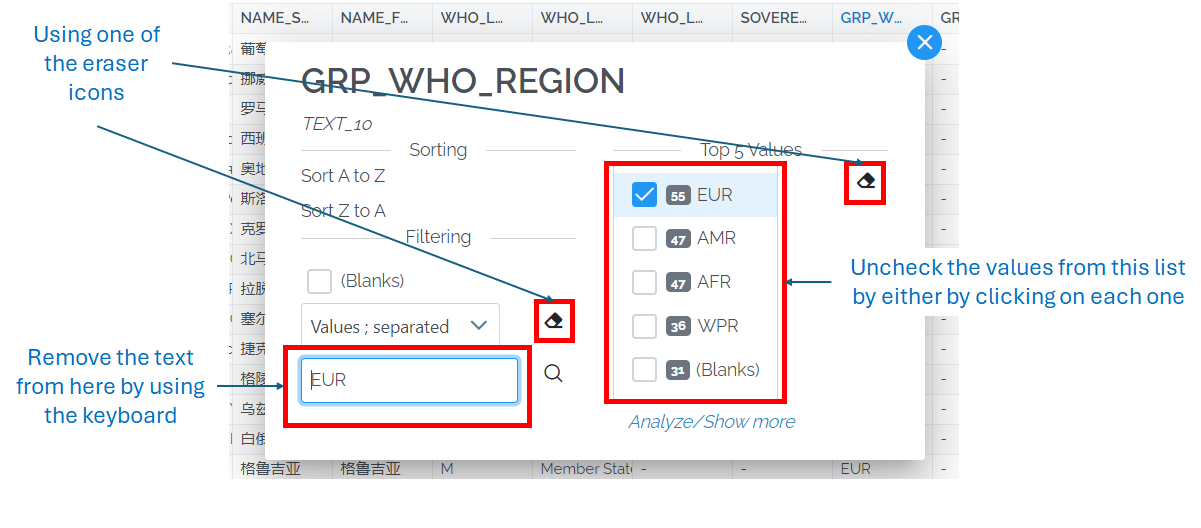
By clicking next to one of the values, you can filter the data.
If a column has been filtered then the title colour changes to blue
Removing a filter
There are several ways to remove a filter
The first is by using the funnel directly on the data page
You can also do it from the column pop-up-box
The Data Action Panel
On the Data View page, there is a Data Action Panel

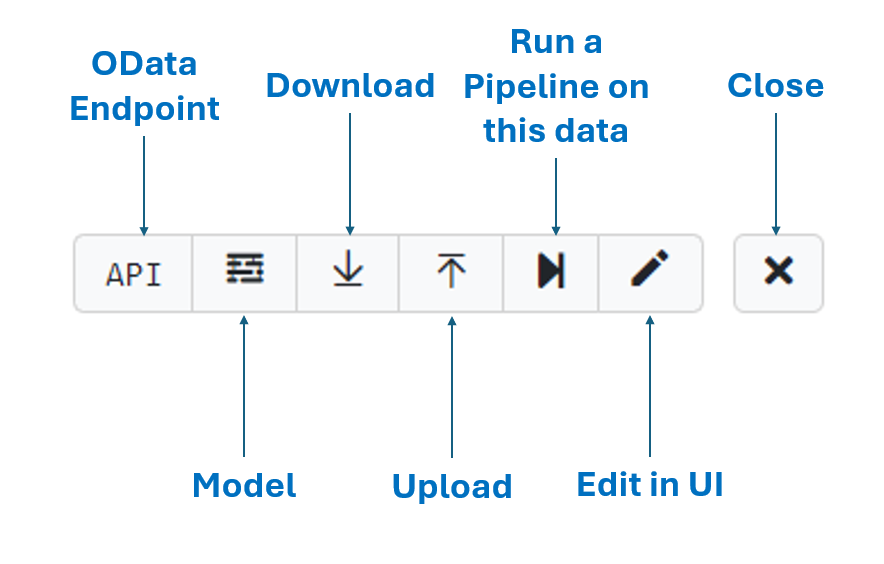
OData Endpoint
Model
Download
See Download data
Upload
See Upload data
Run a Pipeline on this data
Edit in UI
See Edit Data in UI
Close
Goes back to the main data page
